UK savings statistics 2025

This page includes relevant UK savings statistics for 2025, looking at alternative ways people can save money, how much the average UK adult has in their savings and the best apps for saving money.
Recent UK savings statistics for 2025 from the Bank of England (BoE) indicate that January 2025 was the greatest month for UK savings so far, with £9.14 billion deposited into banks and building societies.
Savings are a crucial part of money management. Whether it’s putting money aside for a particular purchase in mind, or building up a rainy day pot for something unexpected, comparing savings accounts will ensure you select the one that is right for you.
Our savings statistics report has gathered the most recent UK household savings statistics, such as how much UK households have deposited into savings, what proportion of a person’s savings should be saved, along with the main reasons for saving according to Brits.
Top UK savings statistics to be aware of in 2025
October was the greatest month for savings in 2024, with nearly £19 billion deposited.
The 2025/26 year started strong, as UK adults deposited nearly £3 billion into banks and building societies in April 2025.
Men are estimated to have 82% more in savings than women.
One in six (16%) UK adults have no savings.
Exclusive data suggests adults should save £37,430 by their 30th birthday, but, on average, those aged 25-34 only have £9,357 saved.
The most popular reason for saving money is for a ‘rainy day’ (55%).
Almost three in 10 (28%) of adults state saving money is a habit.
Over a third (36%) of households had to dip into their savings to make ends meet in the six months to November 2024.
The Money and Pensions Service (MaPS) has set out a strategy to create a ‘Nation of Savers’ by 2030.
MaPS reports that 11.1 million working adults on modest to low incomes do not regularly save, putting them at risk of not being able to afford monthly bills should their employment circumstances change.
UK savings market statistics
According to UK savings statistics for 2025, UK households deposited just under £3 billion (£2,999,000,000) with banks and building societies in April 2025. This figure is 58.73% less than the total amount deposited in March 2025 and represents a six-month low.
Total monthly deposits in savings accounts over time
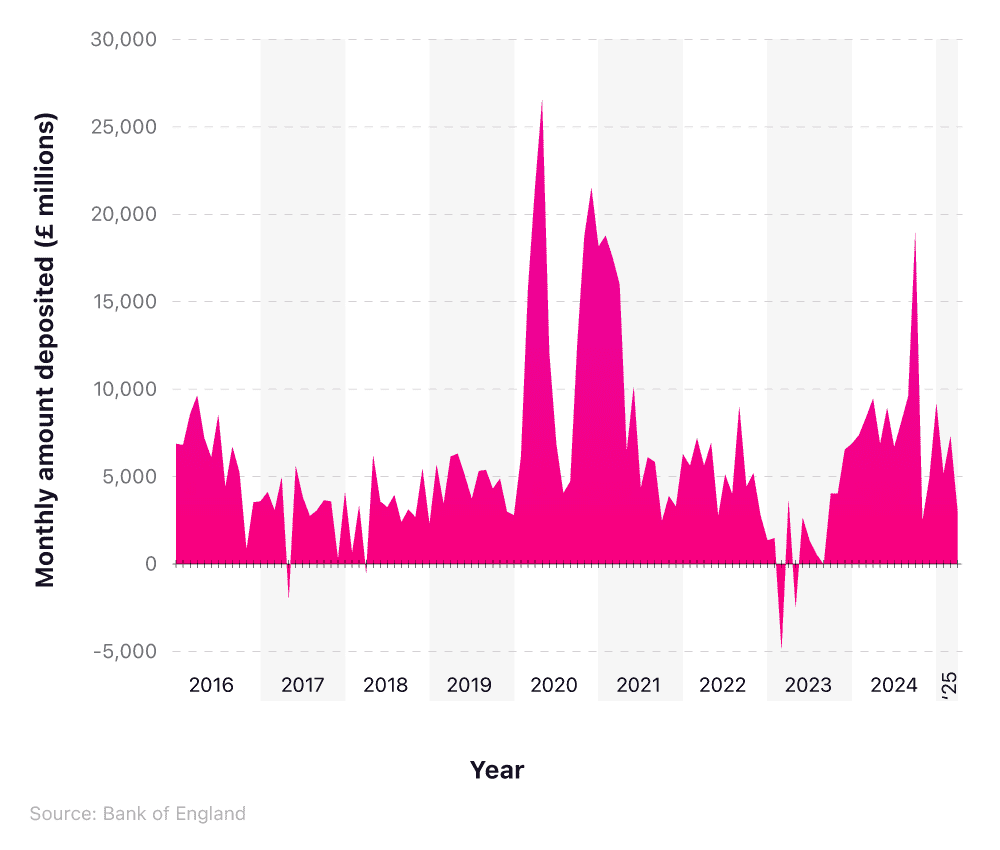
Over the period 2016 to 2025, monthly average savings in the UK were at their highest in May 2020. During the first COVID-19 lockdown, those in the UK were clearly anxious to ensure they had a savings pot, with £26.5 billion (26,524,000,000) deposited into UK banks.
Interestingly, over this 10-year period, UK savings have only been negative on five occasions. During these months, average savings were in negative figures, meaning more money was withdrawn from savings accounts than deposited. These months were:
May 2017
April 2018
March 2023
May 2023
September 2023
2017 was the lowest year for savings since 2011, with Brits reluctant to boost their savings due to the base rate being cut to 0.25% in August 2016. Further, savings may have dipped a year later, in April 2018, due to the introduction of Lifetime ISA penalties against any withdrawals outside of LISA goals, possibly triggering early withdrawals before penalties were enforced.
High inflation and the rising cost of living is likely to have affected people’s attitudes to saving throughout 2023, leading to negative figures in March, May, and September.
For a deeper dive into the condition of the UK savings market, visit our UK savings market trends page for more statistics on average savings and wealth.
How much does an average person have in savings?
Reports on the average savings in the UK vary. According to a 2025 survey by Finder, UK adults have an average of £16,067 in cash savings.
There is a great disparity between genders in regard to adults’ average savings balance. Finder estimates that men have, on average, 82.03% more in savings than women, with £20,810 compared to £11,432.
As a point of concern, two-fifths (39%) of UK adults have only £1,000 or less in savings. This means many adults would be unable to weather life’s uncertainties for more than a month or so. One in six (16%) adults have no savings at all, meaning they are unable to cover bills for a month, should their employment or financial circumstances change.
Survey results from the Money and Pensions Service (MaPS), revealed that, prior to the COVID-19 pandemic, around a quarter of UK adults (11.5 million people) had less than £100 in their savings account, with one in six people having no savings at all.
MaPS also reported that 11.1 million working adults on low to modest salaries do not save regularly.
In 2020, MaPs launched the UK Strategy for Financial Wellbeing, with a 10-year goal of ensuring that ‘everyone [can] mak[e] the most of their money and pensions.’ One of the five main goals of the strategy is to grow a ‘Nation of Savers,’ whereby UK adults have the knowledge and tools to save effectively.
To align with the MaPs ‘Nation of Savers’ national goal, adults of working age (18-66) are categorised into different groups based on their financial security status, two of which are the ‘struggling’ and the ‘squeezed’.
The ‘struggling’ vs. the ‘squeezed’
| The ‘struggling’ | The ‘squeezed’ |
|---|---|
| Least financially resilient | High-risk category |
| Low income | High rates of dependency on credit |
| High rate of benefit dependency | Lack of savings buffer |
| Poor provision for later life | Not prepared for later life |
| Little or no savings buffer | |
| High levels of debt/over-indebtedness |
(Source: MaPs)
According to the UK Strategy for Financial Wellbeing, there are 11.1 million adults across the country who fall into one of these two categories. This equates to over half (56%) of all working-age adults in the UK, and 61% of the total adult population, who are classed as inadequate savers.
The national target is to encourage two million more people to save regularly by 2030. Other aims of the strategy include:
Reducing the number of people using credit to buy by two million
Ensuring that five million more people understand enough to plan for - and in - later life.
In MaPS’ Winter 2024 progress update, it was reported that several strides had been made in line with the Nation of Savers framework, including increased availability of payroll savings schemes and the creation of a savings charter. The latter of these asks savings providers to sign up to five key commitments, all with the aim of raising the profile of savings in the UK.
How much of your salary should you save?
Managing your savings is a highly personalised process. How much you save will depend on the specific reason for saving and the associated time frame
Less than a year - can be used to target a holiday, buy a specific gift, or pay one-off, larger bills (e.g. car insurance).
Less than a decade - might be to cover the cost of large expenditures, such as making a down payment on a house or replacing something significant that breaks (e.g. a boiler).
Lifetime - putting money away for retirement through a lifetime ISA account, for example.
Generally speaking, between 10 and 15% of your income should go towards a comfortable retirement fund. If you have employer contributions, then this can help reduce the burden (i.e. they contribute 5%, and you contribute 5%).
As a rule of thumb, you should establish an emergency fund that can cover up to nine months of your living expenses. This is to account for loss of income should you lose your job, yet still allows you to cover your basic survival costs (i.e. accommodation, bills, food etc.).
Another theory is to follow the 50/30/20 rule, where:
50% of your income should go towards necessities (i.e. needs).
30% goes towards desirable purchases (i.e. wants).
20% goes into a savings account (either retirement, emergencies, or a particular financial goal).
Using this method, up to half of your money is fixed on the non-negotiable aspects of living that you cannot avoid paying out for, such as mortgage/rent, household bills, and groceries.
You may opt for more than 20% towards savings, which is fine and could benefit you in the long run. But any less, and this may mean a longer saving period towards your ultimate saving goals.
The other way to view this is to consider your age bracket. Here is a rough estimate of how much you should be putting into retirement savings by certain points of your life, based on the average annual UK wage of £37,430, as of April 2024.
How much should I save? (Exclusive data)
| How much of your salary you should save | Amount of savings |
|---|---|
| 1 x your salary by the age of 30 | £37,430 |
| 3 x your salary by the age of 40 | £112,290 |
| 6 x your salary by the age of 50 | £224,580 |
| 8 x your salary by the age of 60 | £299,440 |
(Source: money.co.uk)
The bottom line is, there is no hard-and-fast rule regarding how much people should save. Whether it’s 5%, 20%, or more, putting money away today will help prepare you for a more financially secure future.
Attitudes towards saving money
Why do people save money?
The majority of adults (55%) have savings in place for no particular purpose and are simply accumulating money for the future or a ‘rainy day’.
Conversely, a third (34%) of Brits save money with a particular short-term expense in mind, such as for a holiday or Christmas presents.
Brits’ reasons for saving
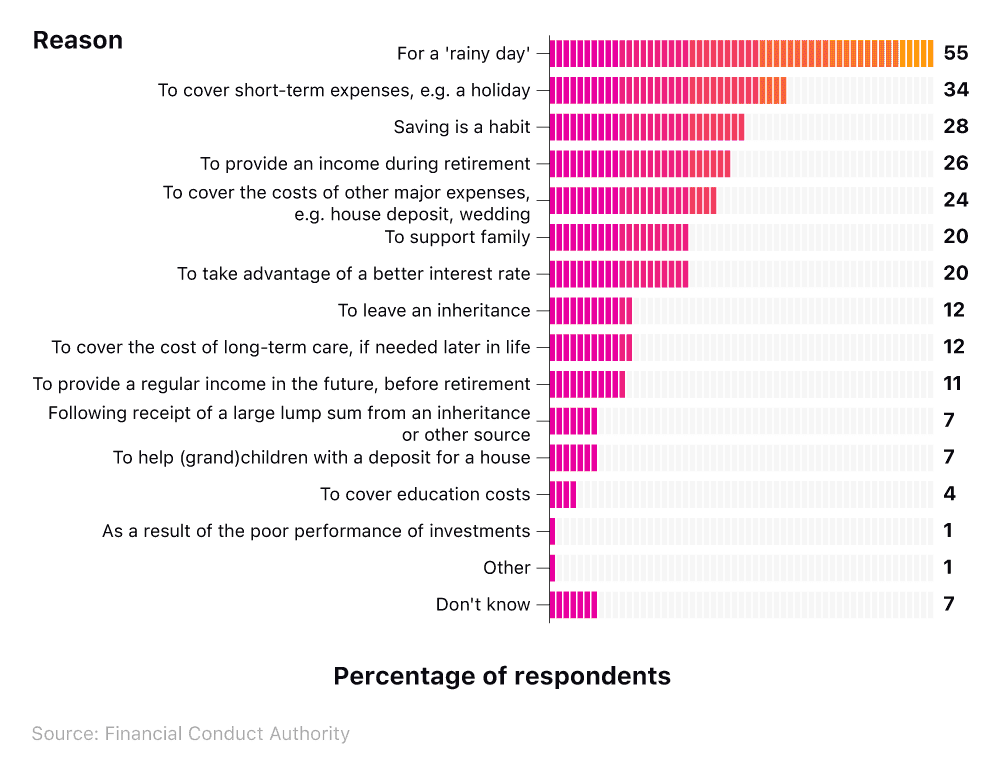
Interestingly, over a quarter (28%) of those surveyed by the FCA state that saving money is simply a habit, indicating that many adults save as it is a learnt behaviour and part of their monthly routine.
Many adults save money with their family in mind, with the following responses all popular reasons for saving money:
To support family (20%)
To leave an inheritance (12%)
To help (grand)children with a deposit for a house (7%)
The impact of the cost of living crisis on savings
Research from abrdn Financial Fairness Trust indicates that many UK households are having to forgo savings or dip into existing savings pots to make ends meet.
Within all UK households, just under half (46%) of respondents have been forced to save less money than they typically would in order to reduce higher living costs. This action is nine percentage points more common (55%) among households in the bottom income quintile.
Actions taken by households in the last six months to reduce costs
| Action taken | All households | Households in the bottom income quintile |
|---|---|---|
| Saved less money than you normally would | 46% | 55% |
| Used money from savings for daily living expenses | 36% | 47% |
| Stopped or reduced pension contributions | 10% | 15% |
| Accessed pension savings earlier than planned | 9% | 15% |
(Source: abrdn Financial Fairness Trust)
Further, over a third of UK households have had to dip into their savings to afford daily living expenses. This is even more common among the poorest households, with nearly half (47%) of these having to use savings in day-to-day life.
The high cost of living is also impacting UK households’ ability to plan for retirement. One in 10 households surveyed had stopped or reduced pension contributions to reduce costs, with 15% of the lowest income quintile doing the same. Moreover, 9% of households had accessed pension savings earlier than intended to afford daily expenses.
Our guide to stocks and shares apps available on the market can help with learning how to choose shares and trade, and run a portfolio from the comfort of your screen.
Glossary
Bank of England (BoE)
The Central Bank of the United Kingdom. It is responsible for setting interest rates and promoting monetary stability.
Consumer Price Index (CPI)
An index measuring the average price of consumer goods and services purchased by households. It is often used to assess inflation.
Interest rate
The amount charged, expressed as a percentage, by a lender to a borrower for the use of money. Interest rates are sometimes considered the reward for saving and the cost of borrowing.
Fixed-rate savings account
A savings account where the interest rate remains the same for a set period, regardless of market conditions.
Individual Savings Account (ISA)
A class of retail investment arrangements available to residents of the UK, providing a favourable tax status.
Real interest rate
The interest rate once adjusted for inflation, representing the real cost of borrowing or real yield on an investment.
Defined benefit plan
A type of pension plan where an employer promises a specified monthly benefit on retirement. The amount is determined by a formula based on the employee's earnings history, tenure and age.
Government bonus
A monetary incentive provided by the government to encourage saving that is paid on top of the money saved in a Help to Save account.
Payment frequency
The regularity with which savings are deposited into an account – for example, weekly, bi-weekly, or monthly.
FAQs
According to our savings market trend report, UK households are able to save just over a tenth (12%) of their income, on average.
The average amount of money a person has in their savings account varies and is based on various factors, including gender, occupation and spending habits, though some data suggests the average person has £16,067 in their savings account on average.
The amount someone should have saved by the age of 30 is not an exact science, with it ultimately being a matter of preference and circumstance. Financial advisers propose that having an emergency fund with three to six months of living expenses is often recommended for financial security.
Another common guideline is to have the equivalent of your annual salary saved for retirement by the age of 30. For example, if you earn £25,000 a year, you should aim to have £25,000 worth of savings in your account.
It’s advisable to focus on cutting down any debt (if you have any) and building up your savings before investing. Ultimately, the amount of your income you're willing to invest depends on how comfortable you are with risk.
We’d advise not investing any more than 20% of your income. If you’re investing, consider diversifying your investments to reduce risk.
Methodology and sources
https://www.bankofengland.co.uk/statistics/money-and-credit/2022/july-2022
https://www.bankofengland.co.uk/statistics/money-and-credit/2022/october-2022
https://www.bankofengland.co.uk/statistics/money-and-credit/2023/january-2023
https://www.bankofengland.co.uk/statistics/money-and-credit/2023/may-2023
https://www.bankofengland.co.uk/statistics/money-and-credit/2023/september-2023
https://themoneycharity.org.uk/money-statistics/march-2022/
https://themoneycharity.org.uk/money-statistics/march-2022/
https://www.bankofengland.co.uk/statistics/money-and-credit/2023/august-2023
https://www.forbes.com/uk/advisor/savings/average-savings-by-age-in-uk/
https://www.finder.com/uk/savings-accounts/saving-statistics
https://maps.org.uk/en/our-work/uk-strategy-for-financial-wellbeing
https://www.raisin.co.uk/newsroom/the-great-british-savings-report/
https://www.fca.org.uk/publication/financial-lives/fls-2024-cash-savings.pdf
https://www.financialfairness.org.uk/en-gb/docs?editionId=2393ecce-d163-458b-aacd-b26000b88f81
Read more like UK savings statistics 2022 :

How does the State Pension work?
Not everyone gets a state pension in the UK, and payouts vary heavily from person to person, even for those who qualify. Here is how the state pension works, what it could pay you and when you can claim it.
Read more about how the State Pension works
About Lucinda O'Brien
Lucinda is a senior finance editor at money.co.uk and helps people to make confident financial decisions so they can make the most of their money.
View Lucinda O'Brien's full biography here or learn more about our editorial policy